
LAT (Lowest Astronomical Tide)
LAT is an internationally standardized reference size for measuring the depth of water and to define the coastal line in sea charts. LAT is short for Lowest Astronomical Tide and is a theoretical value that is calculated in each case by the measured tide levels for the future.
Bases are the tide levels for the last 18.6 years. The time interval of 18.6 years considers two oscillation periods substantial for fluctuation of tides: the nutation period of the Moon (18.6 years) in the ecliptic, and their effect, the lunar nodal tidal constituent, is the most important under the longer components of the tide. The values for LAT are computed mathematically by a harmonic analysis (using so called constituents).
LAT in Hydromagic
In Hydromagic, you can reduce your soundings to LAT by loading a tide file containing LAT tide values. There will is also an option to calculate these values by entering tidal constituents for your area.
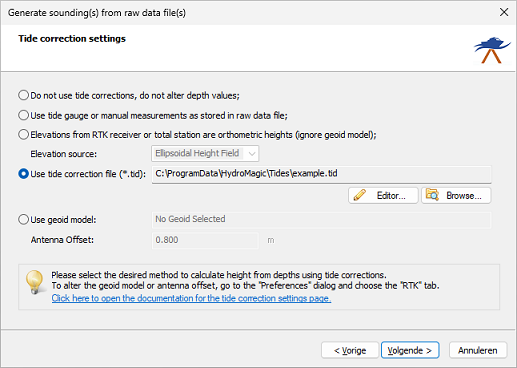
Loading a tide file is part of the process of creating filtered and corrected sounding files using the "Sounding Wizard". You can start this wizard by selecting the "Generate Soundings..." option from the "Tools" menu. Alternatively, you can right click the "Raw Data" folder in the "Project Explorer" and select the "Process Raw Data File(s)..." option from the popup menu.
Importing LAT tide files from ASCII
LAT tide files can be imported in the "Tide File Editor", which is part of the "Sounding Wizard", the tool which is used to convert your raw sounding data into a filtered and corrected sounding file.
The tide editor can be launched from the "Sounding Wizard".
To open the "Tide File Editor", select the "Use tide correction file" option, and click the "Editor..." button. The tide editor is now started using the selected tide file, and should look like this:
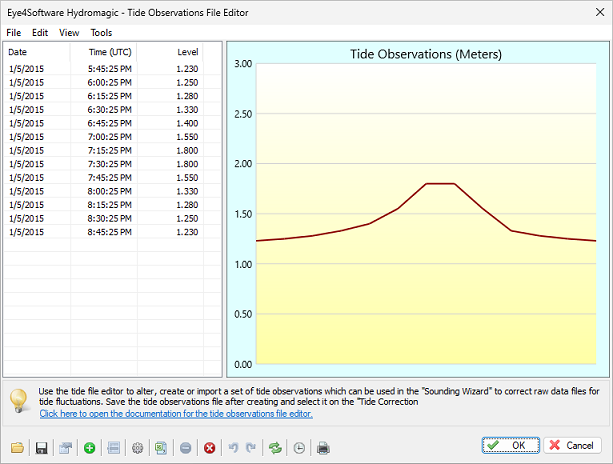
The "Tide File Editor" can be used to import or edit tide observation data.
If a file containing the tide values is in CSV (ASCII) or Microsoft Excel format you can import it into Hydromagic. Please note that you have to use Microsoft Excel to convert XLS or XLSX files into CSV format first. Other file formats are not supported. In these cases you have to enter all tide values for the period of your survey by hand. To start importing CSV files, click the "Import CSV" button (marked with a red rectangle in the image above).
CSV import tool
After the import tool has been started, select the file containing the tide observations or predictions first by clicking the "Browse..." button. After the file has been selected, click the "View..." button to inspect the format of the file.
Next, select the field separator, which would be in most cases, a comma. The date for the data can be read from the file, or selected manually in cases where the date is not present in the file. Select the field number for the date and date format when the date is in the file.
Use the next section of the window to select the column used for the time as well as the time format. When the time format used in the file is not supported, please contact support.
Finally you have to select the field that contains the tide level. For files in the United States, you probably have to select the units to "Feet". For most other countries, leave this field to "Meters".
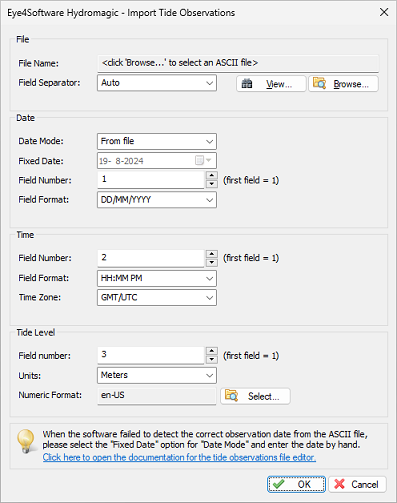
The CSV (Comma Separated Values) import tool in the tide editor.
CSV tide file examples
Below are examples of the two most used formats to store tidal data as CSV:
  11:10:00 AM,1.446
  11:20:00 AM,1.470
  11:30:00 AM,1.497
  11:40:00 AM,1.522
  11:50:00 AM,1.544
Example of a CSV or ASCII tide file which can be imported into Hydromagic.
The file above shows a tide file containing time stamp and tide level. In this case you have to select the date manually. Set the time field number to "1" and the time format to "HH:MM:SS PM". For the tide level, set the field to "2".
  08/09/2015 00:00:00 1.239
  08/09/2015 00:10:00 1.209
  08/09/2015 00:20:00 1.178
  08/09/2015 00:30:00 1.133
  08/09/2015 00:40:00 1.085
Example of a CSV or ASCII tide file which can be imported into Hydromagic (with dates).
The file above shows a tide file containing date, time stamp and tide level. In this case the field separator is a space. you have to set the date field to "1" and select "DD/MM/YYYY" as date format. Set the time field number to "2" and the time format to "HH:MM:SS". For the tide level, set the field number to "3".
Saving the results
When settings are set according to the internal organization of the file, click "OK" to accept the settings. If everything went well and the file can be parsed, a graph and the tide values will be displayed.
Now click the "Save" button, enter a name for the tide value and click "OK" twice to save the file and close the dialog. You can now continue following the steps in the sounding wizard.
Checking the results
You can check whether the tide corrections have been applied correctly by having a look at the sounding data. To do so, right click the sounding in the "Project Explorer" and select the "Edit Sounding..." option. The "Sounding Editor" dialog should appear, which shows the tide values in one of the columns:
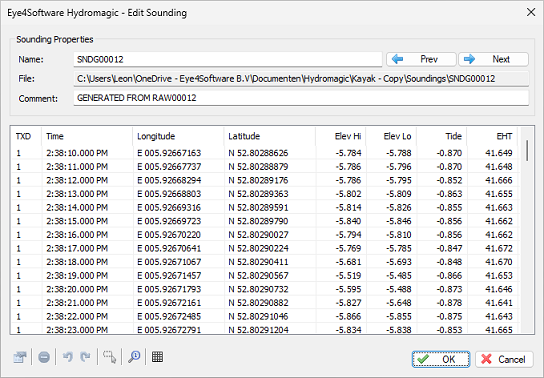
Sounding editor showing tide values.
Sign reversal
When reducing depths relative to a tide level at sea, the convention is that the sign is to be reversed. This is different from measurements of river bottom elevations, which do not have a reversed sign. In case you have to reverse the sign on the map, in exported data or in the sounding editor, select the "Preferences..." option from the "Options" menu and select the "Map" tab.
In the map settings tab, locate the "Reverse sign of elevation values" check box and enable it. Please make sure to disable this option when you have a project where RTK tides are used (Inland).
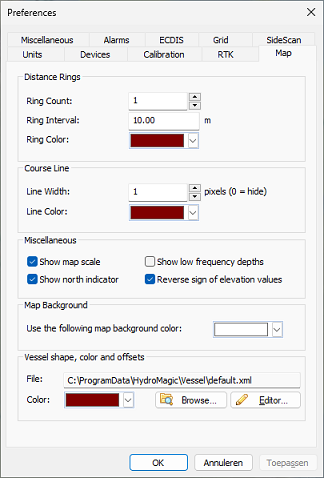
The sign of elevation values can be reversed using the "Map" settings.