
Generate and display a delta matrix
In Hydromagic, a matrix is a collection of regularly spaced depths, which can be projected over the map as color or text. Such data is also referred to as a digital terrain model or DTM.
A matrix can be generated from a collection of soundings and boundaries, or by comparing two existing matrices. The latter method can be used to visualize the difference between two matrices, for instance a matrix generated with a pre-dredging sounding and a matrix generated with a post-dredging sounding. You can also compare matrices generated from two regular soundings at a different time, so you can visualize, for instance, sediment building up.
The new matrix is generated by comparing cell values in both matrices. Make sure the matrices overlap as much as possible and use the same cell spacing. To generate a matrix by comparing two existing matrices, Select the 'Generate Matrix (Delta)...' option from the 'Tools' menu in Hydromagic Survey:
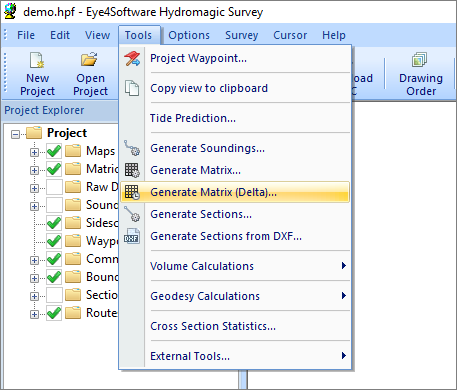
To compare matrices, select the 'Generate Matrix (Delta)...'
option from the "Tools" menu.
Selecting the source data
In the delta matrix generation tool, you must first select the two matrices you want to use to generate the delta matrix. For matrix file 1, you select the sounding with the oldest time stamp (or pre-dredging) sounding and for matrix file 2 the newest matrix (or post-dredging matrix). The layer selection box will be disabled when there is only one layer present in the matrix file. When a matrix file has been generated in Hydromagic Dredging, multiple layers can be used. For each layer, the type of data will be shown (in the screenshot below, both layers contain high frequency depth data).
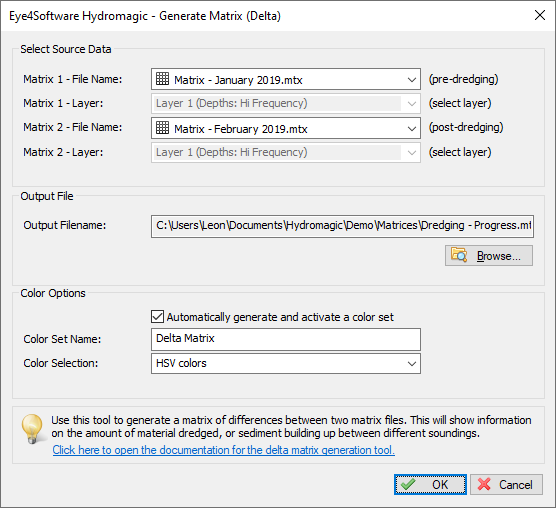
Before generating a "delta matrix", you have to select the matrices to compare.
Selecting the output file
To select the location and file name for the output file to be generated, click the "Browse..." button. You are allowed to select an existing file. In this case, the software will ask you to confirm if you want to overwrite the existing file. If the file is not already part of the project, it will be automatically added to the project tree. Matrix files are written in binary format and are not human-readable. To export the generated matrix file in ASCII format, use the Export ASCII file tool.
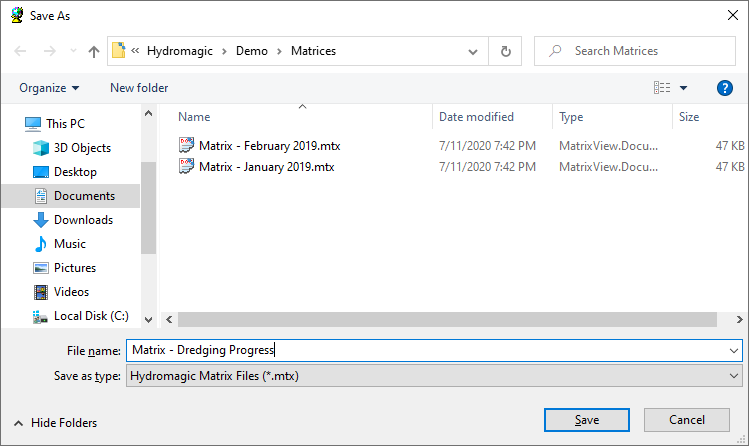
Select an existing or enter a new file name in the "Save As" file dialog.
Generate a matching color set
If desired, you can generate a color set for the resulting matrix automatically. To do so, simply enable the "Automatically generate and activate a color set" option by checking the checkbox in the "Color Options" section. You also have to enter a name for the new color set, so it can be identified in the list of color sets. This newly generated color set will be saved with the project.
The color set is generated by detecting the minimum and maximum differences in the matrices being compared, and the minimum color interval is calculated to limit the number of colors to a maximum of 30. You can select the colors used using the "Color Selection" drop down box.
Generating the matrix
Finally, click the "OK" button to start the process. It should take a couple of seconds, you can watch the progress in the status bar of the main window. The generated matrix will be added to your project automatically and it will be displayed using the colors of the generated color set (if this option was enabled). When no colors are visible, please check the matrix display options as described in the next paragraph.
Displaying the matrix as colors
To change the settings for displaying matrices, right-click the 'Matrices' folder in the 'Project Explorer' and select the 'Display Options...' option from the pop-up menu:
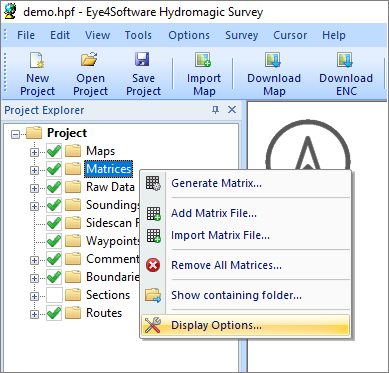
Right click the "Matrices" folder and select the "Display Options..." option.
To show the matrix as colored cells, ensure the 'Display matrix as colors (raster)' option is checked. This will cause the matrix to be drawn using the selected or generated color set.
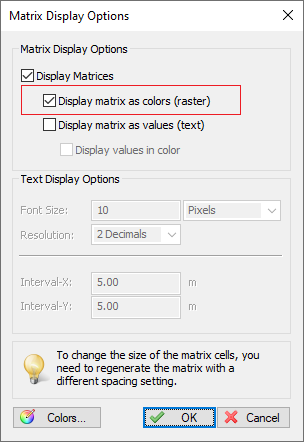
Select the "Display matrix as colors (raster)" option.