
Graph based editor
The graph based editor can be used to remove unwanted or inaccurate data from your raw data files by using a graph display editor, similar to an echogram editor. Because a graph is displayed, which shows the relationship between time and the measured data value, you can easily see which data does not make sense and take appropriate actions.
In the graph based editor you have the following tools to clean the data:
- Range filter - similar to the one in the filter tool
- Data selection and remove - select data to remove using the mouse.
- Remove above - remove all data above the line drawn;
- Remove below - remove all data below the line drawn;
- Median filter - use a "median filter" to filter out small spikes and smooth the data;
- Mean filter - use a "mean filter" to filter out small spikes and smooth the data;
The example below shows a graph containing GNSS elevation values before filtering. Spikes can occur in GNSS (RTK) elevation data when, for instance, the RTK fix is lost for a moment.
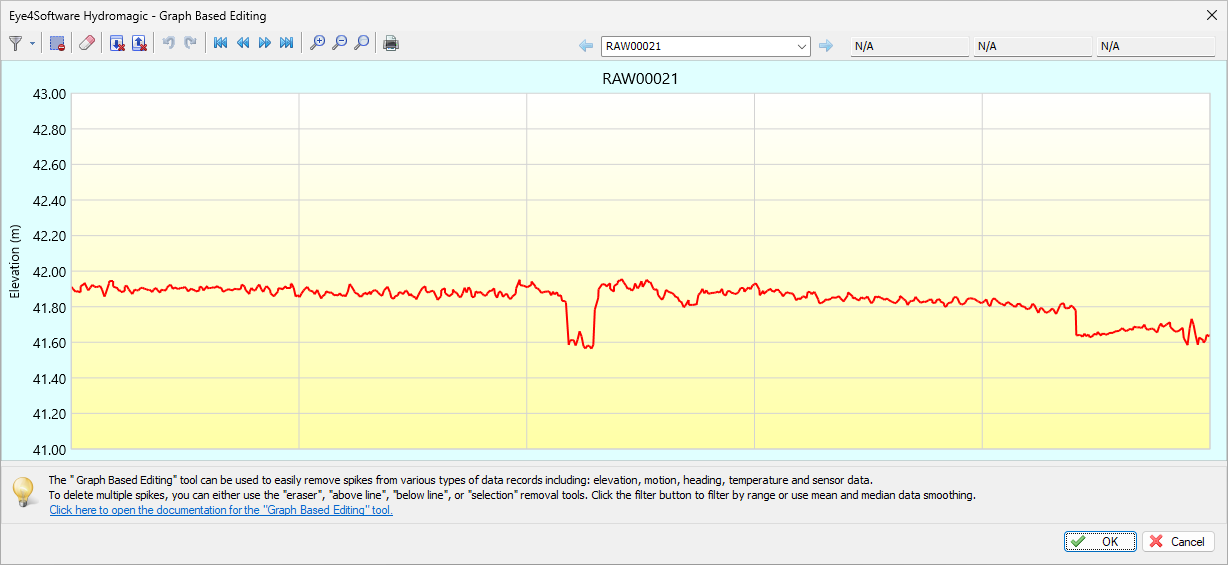
Example of a GNSS elevation graph with errors.
Range Filter
To filter out of range data from within the graph based editor, click the small arrow next to the leftmost button and select the first 'Range Filter...' option, or the second 'Range Filter...' option, or the second "Range Filter..." option to apply the filter to all selected raw data files.
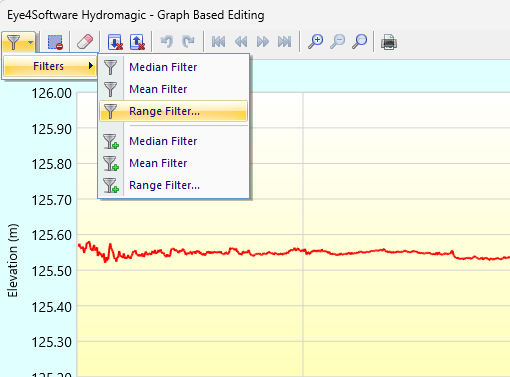
Use the range filter tool to filter out invalid values.
Now enter the minimum and maximum allowed elevation values. In this example, the correct elevation data seems to between 125.50 and 125.60 meters, so we can use these values.
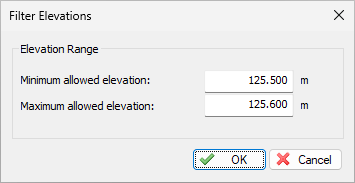
Select the minimum and maximum allowed elevation values.
Removing spikes in data by hand
To remove spikes in data by hand, the eraser tool can be used. After selecting this tool, the cursor shape will change into a rectangle which can be used to select and erase data from the graph. Just remove spikes that are larger than a couple of millimeters on the screen: small spikes will be smoothed out when applying the median filter after this step. If you accidentally remove too much data, click the 'Undo' button or press 'Control' + 'Z' on your keyboard to undo the last step. In the unlikely scenario that everything has been lost beyond repair, go to the file selection page and choose the "Start editing from original raw data" option to start from the original raw data.
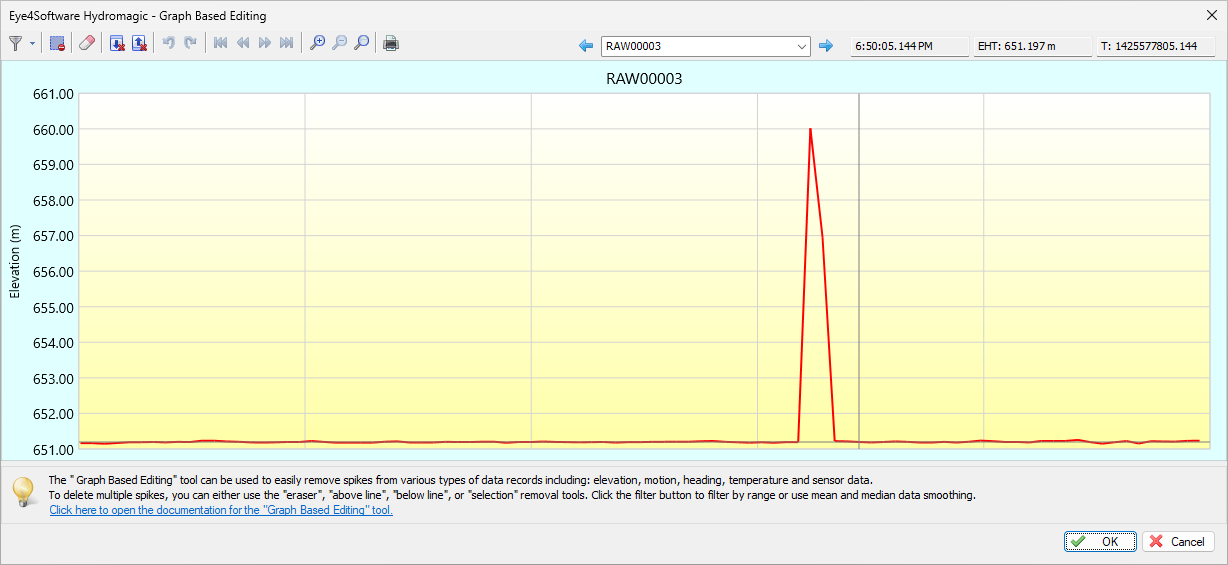
Simple peaks in the graph can be easily removed using the eraser tool
Median and Mean filters
The median and mean filters can be used to further smooth the data which also suppresses the small spikes that were left behind after the manual spike removal process. To apply the median filter, click the small arrow next to the left-most button and select the first "Median Filter..." option, or the second to apply the filter to all selected raw data files.
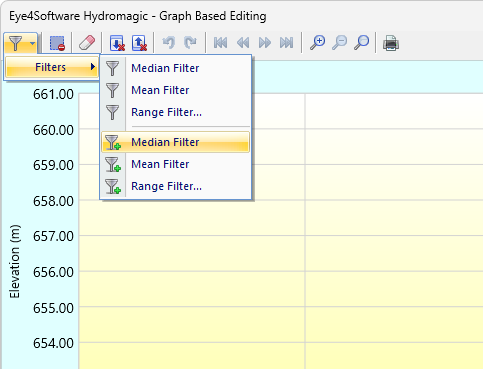
Use the median filter tool to further smooth the data after manual spike removal.
You can apply the median filter multiple times until the desired smoothing level has been reached. When there are still spikes, you can remove them by hand and then apply the median filter again. The mean filter can also be used to smooth the data, although we recommend to use the median filter since it preserves the data better.
Video Tutorial
The following YouTube video tutorial shows how to use the graph based editor to clean elevation data received from the GNSS receiver. Click below to play the video. When you like the video, please click the like button and subscribe so you will receive an update when new video tutorials on Hydromagic are uploaded.
This video demonstrates how to clean up elevation data.