
Cross section statistics
The cross-section statistics tool in Hydromagic can be used to test the quality of your survey data. This function only gives information on whether the correct latency values are used, the positioning system is working correctly and has a stable fix, and if the data is coming in without delays.
To use cross-section statistics, you must run perpendicular lines during your survey and store each line as a separate raw data file. You need to set up perpendicular cross-sections in your project as well as shown below:
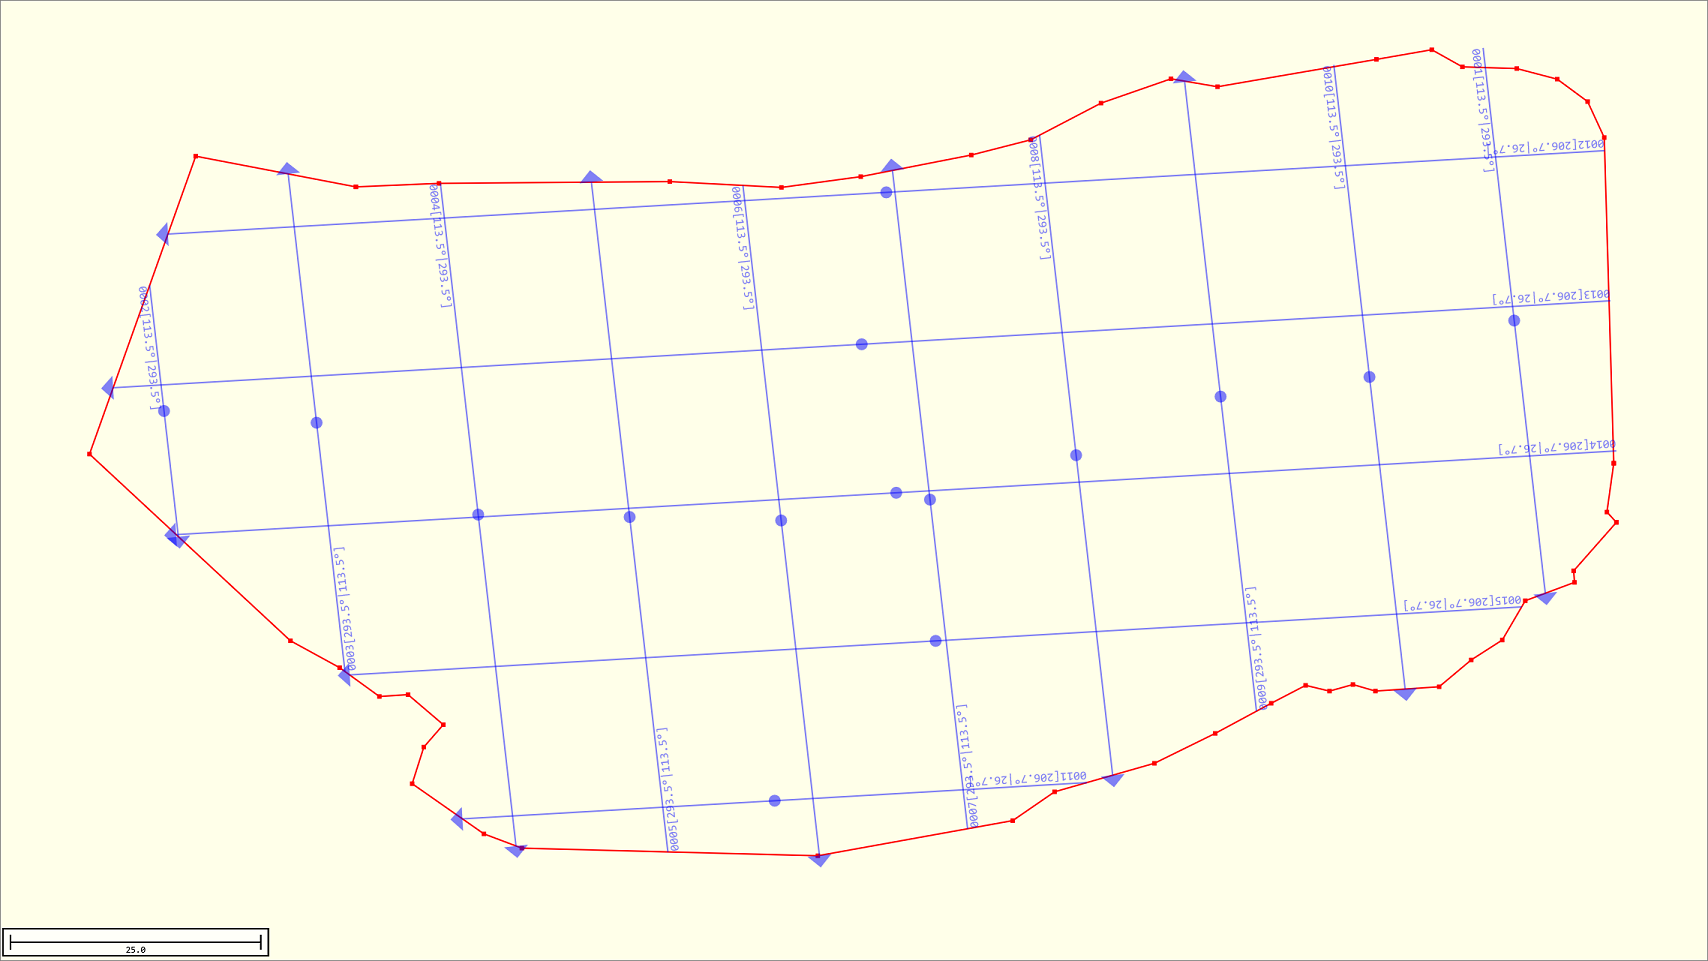
In order to use cross section statistics, generate a grid of perpendicular planned lines (or cross-section lines).
How Cross-Section Statistics are Calculated
In order to calculate cross section statistics the following steps are performed by the software:
- Intersections of the (selected) cross sections are calculated;
- Closest intersection of (selected) soundings near this intersection point is calculated within a certain radius;
- Depth value for first sounding at intersection point is calculated by interpolation;
- Depth value for second sounding at intersection point is calculated by interpolation;
- The difference between these two values is used for the global statistics.
Start the tool
To start the cross-section statistics tool, select the 'Cross-Section Statistics' option from the 'Tools' menu. The tool will open with the last settings:
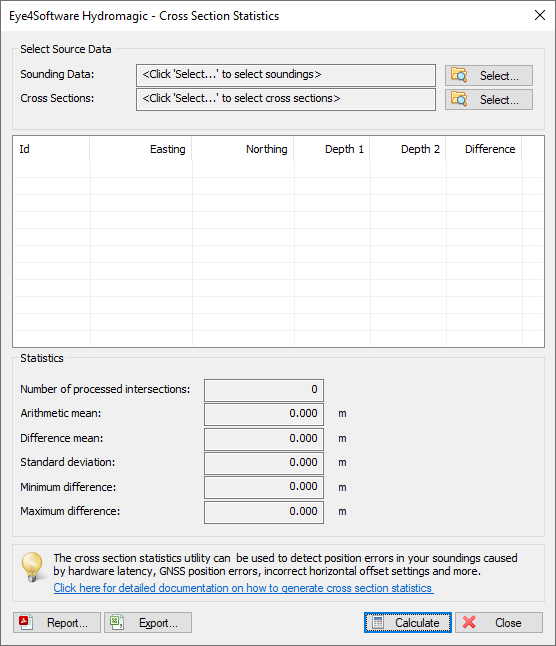
To start, first select the generated soundings and cross sections to use.
Selecting sounding data
After performing the hydrographic survey, you must first convert your raw sounding data to corrected sounding files. This can be done by using the built-in "Sounding Wizard". Click the "Select..." button next to the soundings input field. In the selection window that appears, select at least two soundings that cross each other.
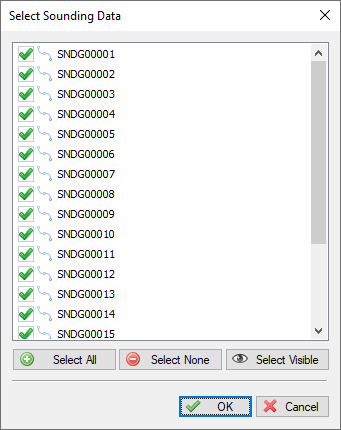
Select the soundings to include in the cross section statistics report.
Selecting cross sections
Click the "Select..." button next to the sections input field. In the selection window that appears, select at least two sections that cross another cross-section.
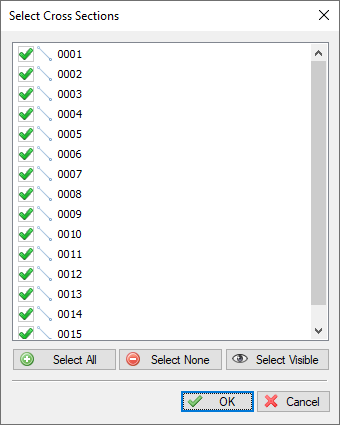
Select the soundings to include in the cross section statistics report.
Calculating cross section statistics
After selecting the cross sections and sounding data to use, just click the "Calculate" button to get the results. If no results are displayed, no crossing soundings or sections are found, or the soundings are too far away from the cross sections.
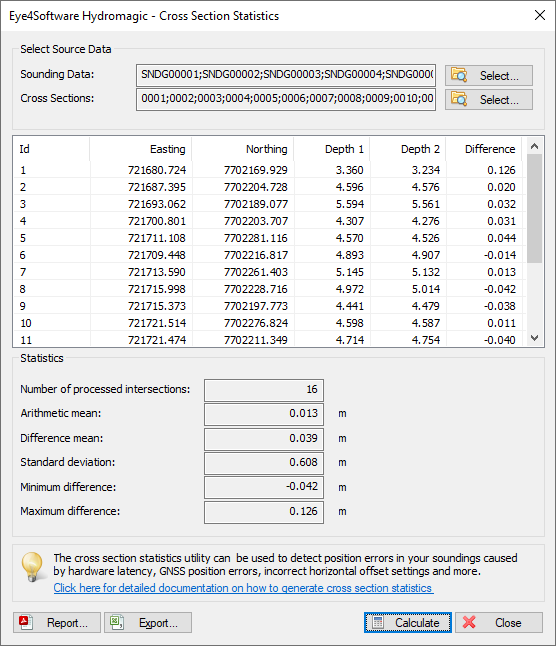
After selecting the soundings and planned lines, click "Calculate" to calculate the errors.
The table shows all the coordinates where soundings cross with the depth values for both soundings. When the position information is correct, vessel offsets are set correctly, and there are no issues with latency, the values should be almost the same. The lower the difference between these two depth values, the higher the quality of the soundings. This difference is shown in the last column. The statistics section at the bottom of the page displays the average statistics for all selected soundings.
Exporting data to excel
To export the calculated cross-section statistics to Microsoft Excel, click the 'Export...' button. Next, choose the file name for the exported data. The data is stored as a comma-separated values (CSV) file, which can be opened in most software. Below is an example of the above data stored as comma separated values file:
ID,Easting,Northing,Depth1,Depth2,Difference
1,721680.724,7702169.929,3.371,3.234,0.138
2,721687.395,7702204.728,4.592,4.576,0.016
3,721693.062,7702189.077,5.594,5.561,0.032
4,721700.801,7702203.707,4.294,4.250,0.044
5,721711.108,7702281.116,4.602,4.533,0.069
6,721709.448,7702216.817,4.893,4.907,-0.014
7,721713.590,7702261.403,5.091,5.143,-0.051
8,721715.998,7702228.716,4.972,5.014,-0.043
9,721715.373,7702197.773,4.442,4.479,-0.037
10,721721.514,7702276.824,4.589,4.596,-0.006
11,721721.474,7702211.349,4.712,4.754,-0.042
12,721727.086,7702223.742,5.168,5.198,-0.029
13,721727.096,7702192.720,3.033,3.000,0.034
14,721732.070,7702274.143,5.111,5.131,-0.020
15,721734.622,7702205.848,3.126,3.027,0.100
16,721738.125,7702249.197,5.278,5.260,0.018
Creating a report
In addition to Excel exports, you can also generate a PDF report containing the calculated statistics. To create a report, click the "Report..." button and supply the software with a valid PDF file name. By default, PDF reports are generated under the 'Reports' folder in your project folder. To view reports, you should have a PDF viewer installed, such as 'Acrobat Reader' or 'FoxIt Reader. Windows 8, 8.1, and 10 users can use the built-in 'Reader' application as well.
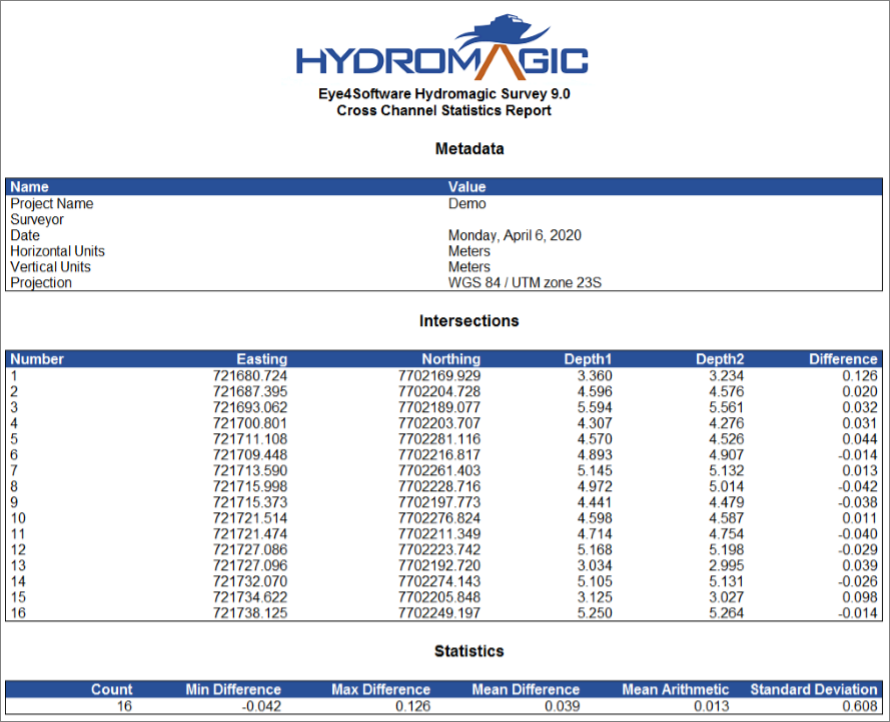
A PDF report of the results can be generated by clicking the "Report" button.