
Hydromagic Data window
The Data window is used to display all incoming data from the hardware or simulators. The data window is integrated in the Hydromagic environment as a docked window. By default, it is displayed left of the map display. The following information can be displayed in this window:
- Current position in WGS84 geographic coordinates;
- Current position in the selected local grid;
- Ellipsoidal height of the GNSS antenna;
- Echo sounder depths for high and low frequency;
- Bottom elevations for high and low frequency;
- Current tide level (either manual, receiver or RTK);
- Vessel heading (true or magnetic);
- Vessel speed over ground;
- GNSS information like fix quality and satellite count;
- Dilution of precision (PDOP, HDOP and VDOP);
- Estimated position error calculated by the GNSS receiver (NMEA0183 GST sentence required);
- Current time and date (UTC);
- Current time and date (local time);
- User-defined point position readings;
- Navigation information;
- Recording status (raw data file);
- Information for drones or USVs: Battery status, autopilot status, current waypoint;
- Motion sensor data: heave, pitch and roll;
- Water and / or air temperature;
- Environmental sensor data;
- Reported sound velocity.
Invalid, missing or unreliable data is displayed in red. If data has been received in the last three seconds and is valid, it will be displayed in green.
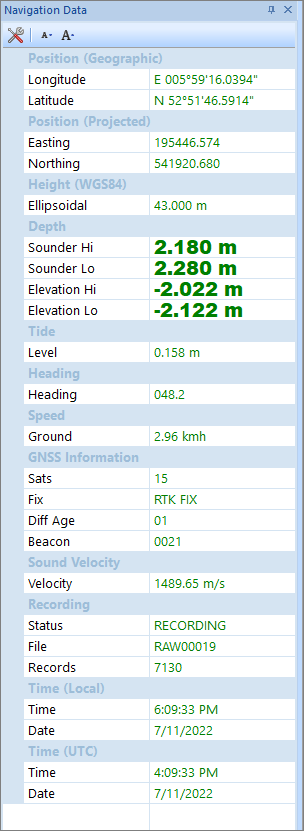
Example data view window configuration
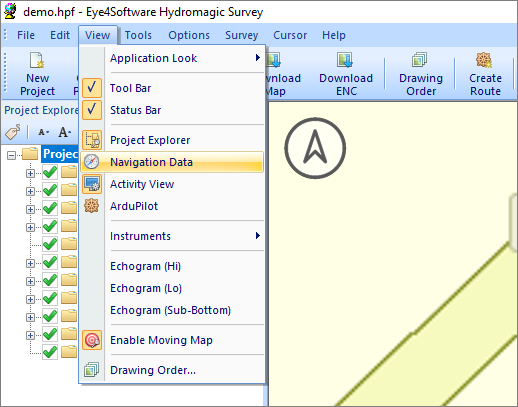
Showing or hiding the window
By default, the data window is displayed as a docked tabbed window. To show or hide this window, select the 'Navigation Data' option from the 'View' menu.
Show or hide the data view window from the main menu.
Sometimes the window is already displayed, but as a tabbed window.
You have to select the "Navigation Data" tab to bring the window to the foreground.
This tabs look like the image below:
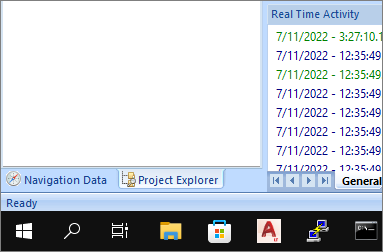
Click the "Navigation Data" tab to activate the view.
Adjusting font size
When not all selected items fit in the window, you must either remove some items or decrease the font size. It is not possible to use the scroll bar, since the view is updated all the time. There are three ways to adjust the font size: from the settings dialog (see below), using the font size buttons at the top of the Data view, or by selecting the window and using the mouse wheel together with the 'CTRL' key on your keyboard. Adjust the font size so that all items fit the screen.
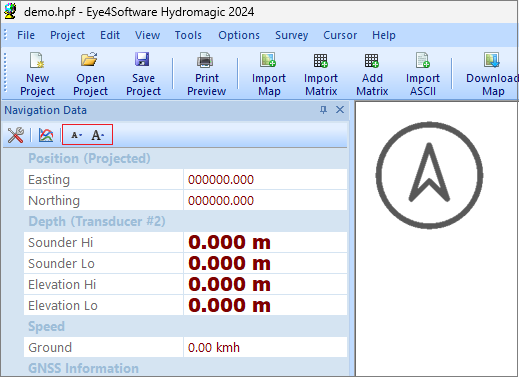
Use the font size buttons to fit all items in the window.
Select active transducer
When using a multi-transducer echo sounder system like the Unabara Z-Sweep, you can use this option to select the transducer for which the depth will be displayed in the data window. This setting applies to both the hi and lo frequency depths. To select the active transducer, click the button right of the configuration button.

The second button can be used to open the transducer selection.
When clicking the transducer selection button, a list containing all transducers with their offsets relative to the vessels center will shop up. To change the active transducer, just double-click the transducer in this list. The transducer number currently displayed in the Data view is mentioned in the label for the depth information section:
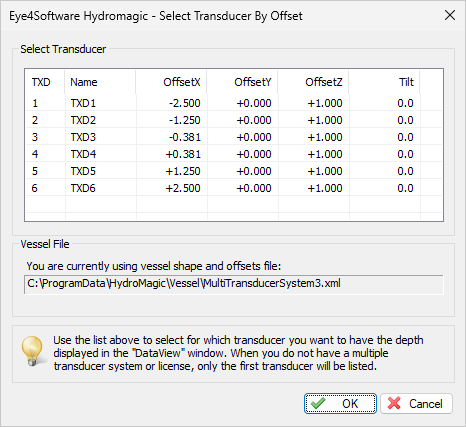
Double-click the transducer for which to display depth information.
Select items to display
You can easily modify the data window by showing and hiding items. By showing only the needed information, the display will become more well organized. To select the items to display, right-click on the data window to show the following dialog. You can select the items to display by checking them.
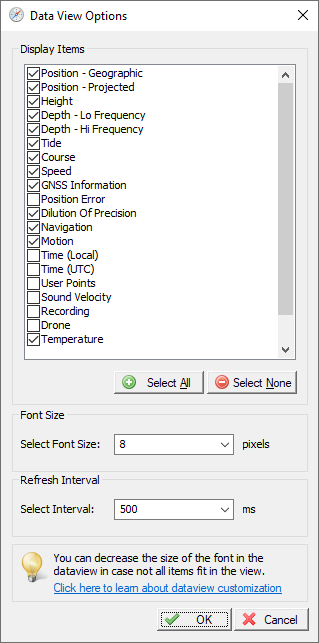
The data view window can be customized to your needs.
Position - Latitude / Longitude
Your current GNSS position in WGS84 latitude and longitude format (geographic coordinates). It is possible to change the coordinate display format used. The display format can be modified in the "Units" tab in the preferences window ( "Preferences..." from the "Options" menu ).
Position - User Selected Grid
Your current GNSS position displayed as easting and northing coordinates. This projection is the same as the one displayed in the status bar at the bottom of the screen (the projection selected at the time the Hydromagic project was created).
Height
Altitude of your GNSS antenna. Depending on the GNSS or RTK settings, this can be the altitude above mean sea level (MSL), or the altitude above the WGS84 geoid (in most cases the latter). The altitude can be displayed in meters or feet. Which units is used depends on your project settings. Once a project has been created, you cannot use the vertical or horizontal units of measure. The GNSS altitude corrected with the antenna height (tide) can be displayed by selecting the "Tide" item into the data view window.
Depth
Displays both the low and high frequency (if applicable) depths returned by the echo sounder, as well as the depths corrected with the current tide value (elevations). When the connected echo sounder does not have dual frequency capabilities, both the "Sounder Lo" and "Corrected Lo" values will remain invalid (red color). Please note that the depth displayed in the Data view has ONLY been corrected with the transducer depth. It is not corrected for sound velocity or dynamic draft in realtime.
Tide
Displays the current tide value. Depending on the settings, either the manual, RTK, or tide receiver tide level will be displayed here. When RTK tides are used, this value is only accurate when the GNSS receiver has a RTK fixed position solution.
Heading
Heading or course calculated by the GNSS receiver or measured by a compass or gyro. Also known as course over ground. Depending on the heading sensor used, true or magnetic heading will be displayed here. You can switch between heading modes from the "Calibration" tab in the "Preferences" window. This window can be opened by selecting the "Preferences" option from the "Options" menu at the top of the main screen.
Speed
Speed calculated by the GNSS receiver. Also known as speed over ground. The speed can be displayed in miles per hour, meters per second, knots, or kilometers per hour. The current speed unit setting can be modified from the "Units" tab in the preferences window ( "Preferences..." from the "Options" menu ).
GNSS Information
This option can be selected to retrieve more information on the GNSS fix. This section in the data window includes the quality of the GNSS fix (no fix, GNSS fix, SBAS fix, RTK fix, etc.), the number of satellites used, and some basic information on the DGPS/WAAS or EGNOS reference station used (not available when using EGNOS/WAAS/RTK).
Motion
Display motion information received from a motion sensor, IMU, or echo sounder with built-in motion or heave sensor. Enabling this option will display heave, roll and pitch information in the data view.
Sound velocity
When a sound velocity probe is used during the survey, the current speed of sound (sound velocity) will be displayed here. This display can be toggled between feet and meters per second from the "Units" tab in the preferences window ( "Preferences..." from the "Options" menu ).
Position Error
This item displays the estimated position error as calculated by your GNSS receiver. Please note that the NMEA 0183 'GST' sentence needs to be enabled in your receiver's firmware to receive this information.
DOP
This option can be selected to enable the DOP (Dilution Of Precision) section in the data window. It shows PDOP (overall dilution of precision or position dilution of precision), HDOP (horizontal dilution of precision) and VDOP (vertical dilution of precision). Low DOP values will result in low accuracy position information or losing RTK fix.
Navigation
This items is only populated with data when an autopilot is used. It shows the distance and bearing to the next waypoint.
Recording
Shows whether raw data recording is enabled or not, the raw data file name which is currently recording, and the number of item in the raw data file. You can use this item to check if raw data is recording without issues.
Drone (USV/AUV)
Please note that this item is only available when an ArduPilot compatible autopilot is used (e.g., Cube, Pixhawk, etc.). You also need to load the "MavLink" plugin. When communication with the autopilot is established, you can monitor battery voltage and current, the next waypoint in the route, the autopilot mode, and whether the motor(s) of the USV are armed.
If you are using an Xbox controller to control your USV, and you have loaded the Game Controller (Xbox) plugin, the "Drone (USV/ASV)" section will be followed by the 'Controller' section, which displays whether the controller has been connected. When using the dedicated wireless dongle for the Xbox controller, the current controller battery voltage will be displayed here as well.
Time (Local)
Displays the local time and date. For more information on how to change the date and/or time format, please have a look at the "System Settings" manual entry.
Time (UTC)
Displays the UTC time and date. For more information on how to change the date and/or time format, please have a look at the "System Settings" manual entry.
Temperature
When you own an echo sounder that reports water temperature, or any other (supported) device capable of measuring and reporting water and/or air temperature, the current temperature is displayed here. Temperatures can be displayed in Celsius, Fahrenheit, Rankine or Kelvin units of measurement. To change the unit of measurement, go to the "Units" tab in the preferences window ( "Preferences..." from the "Options" menu ).
Sensors
Since Hydromagic version 2024, the software is capable of recording data from up to twelve environmental sensors in real-time. By choosing the sensor option all twelve values will be displayed in the data view. To hide some of the sensor values, or to define user-defined labels and units,Here are the grammar and spelling corrections for the provided webpage.
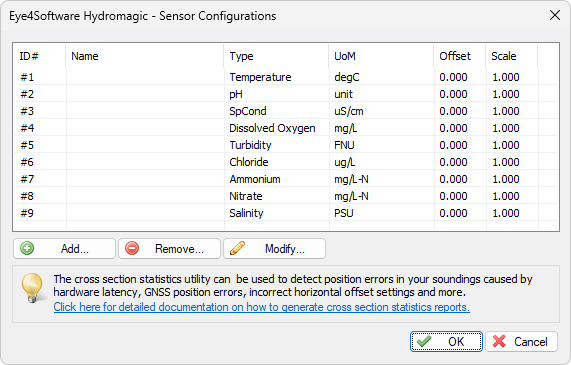
For a more user friendly display of the sensor values, define sensor types and units.