
Return envelope sample files (CSV)
This specialized tool (advanced use) allows you to export the return echo sample values from the return envelope as CSV data. This can be used to further analyze the return envelope data in third party software or plot the data in your own software. The advantage of this method over one of the well known file formats (XTF, SEGY or HYPACK) is that the return values are human readable and can easily be parsed by software or scripts. The intensity of the return values are always written in the range 0 - 65535 (16-bit unsigned value).
Ping#,Channel,Date (short),Date (long),Time,Z-Value,Range (min),Range (max),Index (offset),Number of samples
1,1,02/06/2022,Thursday, 2 June 2022,13:41:19.658 ,1.390,0.000,5.000,0.000,688,65008,64992,64896,64864,64928,64976,65072,65136,65120,65120,63328,55712,65088,65072,50272,15168,17632,24672,17520,5056,6576,9440,6640,2112,3824,3600,1488,1920,1408,1264,1408,832,1136,1200,784,752,768,720,656,672,672,640,624,624,608,640,592,640,608,608,592,576,560,576,576,576,560,560,544,528,512,544,512,512,512,512,512,496,496,480,496,464,496,464,448,448,432,448,448,416,432,416,400,400,400,384,384,368,368,368,368,352,352,336,352,320,320,320,320,320,304,288,304,304,288,272,272,272,256,272,256,256,256,240,224,224,224,240,208,224,208,208,208,192,208,208,176,176,192,192,192,176,160,176,144,160,128,144,128,144,128,144,112,128,112,128,112,112,112,128,384,2480,7008,14080,21760,27664,29808,28448,24848,20544,17504,20064,34896,60352,65008,64992,65024,65008,65056,64336,39264,13824,25008,40784,52896,63552,65072,65056,65072,65088,65088,62416,47664,34592,27072,24432,24336,25488,25472,22432,16400,10832,7984,6752,5200,2864,1904,2576,2800,2512,1488,1024,2448,3840,4768,5072,4336,3072,1952,992,416,304,256,288,272,400,384,560,784,960,976,832,688,512,464,384,448,544,800,928,1024,864,688,496,464,512,576,672,704,720,624,560,400,240,256,192,112,96,96,96,144,192,320,368,400,288,256,128,80,64,96,160,176,176,96,64,48,80,64,176,256,368,400,480,400,288,112,32,16,16,16,32,0,16,16,80,112,96,0,0,16,80,160,128,80,16,16,0,0,16,16,0,16,16,32,16,64,64,80,32,32,48,32,32,48,48,32,80,48,80,48,32,48,32,48,32,32,64,96,112,128,64,48,112,304,544,672,784,848,896,848,688,480,256,112,80,304,656,1040,1296,1504,1552,1408,1120,736,320,160,512,912,1264,1360,1424,1328,1264,1136,1168,1200,1280,1168,944,592,320,112,96,320,528,800,944,1072,944,736,416,272,288,288,288,224,160,96,112,208,288,384,416,464,464,480,464,384,304,160,96,80,96,112,208,240,272,208,160,64,80,80,80,96,96,80,96,80,80,80,80,80,80,112,96,80,80,80,80,96,80,64,80,80,96,112,128,96,80,80,80,96,80,80,96,80,96,96,80,144,176,240,192,160,80,80,64,80,96,128,128,144,112,112,96,112,80,80,80,80,80,64,80,80,80,80,80,80,96,80,96,96,64,80,80,80,80,64,96,64,80,80,80,80,80,80,80,64,96,64,96,96,80,80,80,112,80,96,96,128,112,80,80,64,80,96,80,80,96,80,80,80,64,80,80,64,64,64,64,80,80,96,64,80,64,96,64,64,64,64,64,64,64,64,64,64,64,64,64,64,80,64,80,64,64,64,64,64,80,64,64,64,80,80,80,80,64,80,64,64,80,64,64,64,64,80,64,64,64,64,64,64,64,64,64,48,64,48,64,64,64,64,64,80,64,64,80,80,64,64,80,64,64,64,64,48,64,48,64,64,80,48,80,48,64,64,64,80,48,112,80,80,48,64,64,64,32,48,48,64,64,48,80,48,48,48,80,48,80,48,64,64,64,48,48,48,48,48,64,48,48,48,48,48,48,64,64,64,64,64,48,64,64,32,48,48,48,64,64,64,48,48,64,64,48,32,48,48,48,48,48,64,64,48,112,304,304
Example of exported return envelope sample values (use scroll bar to view all values).
Starting the samples export tool
The samples export tool can only be started from the "Raw Data File Manager" in Hydromagic Survey. First open the "Raw Data File Manager" by right-clicking the "Raw Data" folder in the "Project Explorer". From the pop up menu which appears, select the "Manage Files..." option.
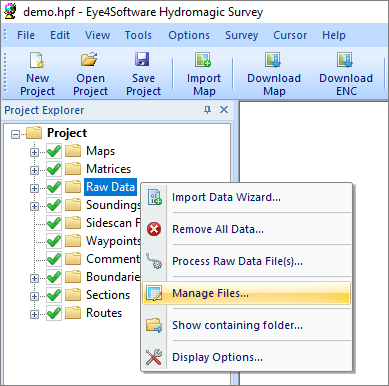
Right click the "Raw Data" folder and select "Manage Files...".
In the "Raw Data File Manager", multiple export options are offered, including HYPACK, SEG-Y and XTF format. Using the exporting tools, you can export one or more files. Select the raw data files you want to export and click the "Export Samples.." button to start the samples export tool.
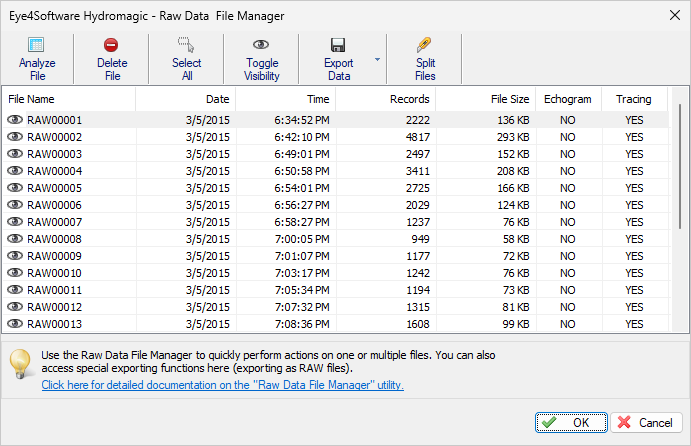
The raw data files manager shows a list of raw data files in the project.
Select output folder
Click the "Browse..." button to select in which folder the CSV files will be written. By default the "Exports" folder in your project map will be used, unless you selected another folder in the past. When one or more files already exist you will be notified. To force replacement of existing files, check the "Overwrite existing files without warning" check box.
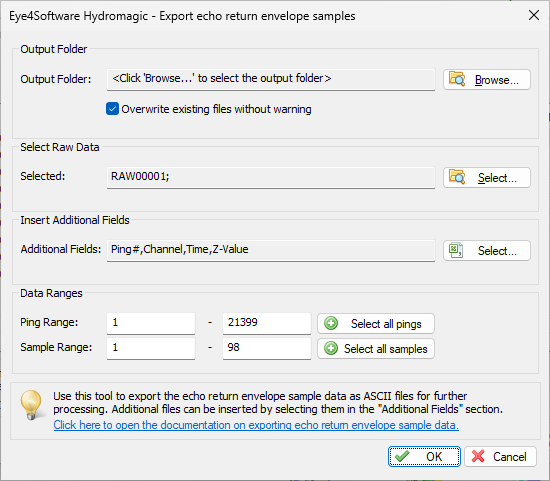
Before exporting data, select the output folder, included data fields and sample range.
Select file(s) to export
When you didn't select any file from the "Raw Data File Manager" tool before opening the export tool, you can select the files to export by clicking the "Select..." button. From the windows that opens, you can select the files to be exported by setting the check boxes.
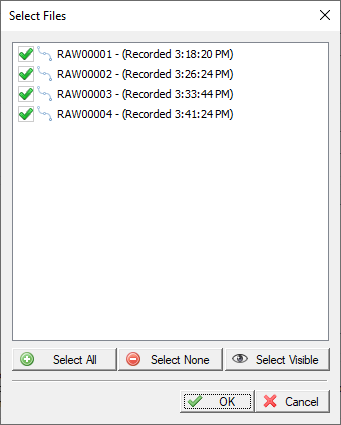
Select which raw data files will be included in the export.
Select which data fields to include
To identify the sample data which is exported, it is possible and recommended to insert some extra data before the actual sample data. For example: date, time and ping number of the sample, but also information on how to parse the data, such as number of samples in the ping and the depth range.To select which fields to include, just click the "Select..." button in the "Insert Additional Fields" section. The following dialog box allows you to set the included fields and the field order. Please note that the sample data is always written AFTER the selected data fields.
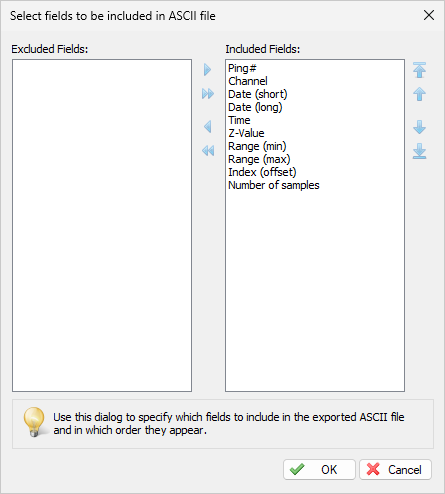
Select additional data fields to export along with the sample data.
Supported data fields
Below you will find a short description of the additional data fields which can be written to the exported file along with the exported water column samples. If you need more detailed information on one of the fields, feel free to contact our support staff.
Ping#
The ping number is the sequential, unique number of the ping written. This number will start at one and is increased by one for each ping written to the exported samples CSV file.
Channel
Include this value only when dealing with dual frequency depth data. This number indicates whether the data is from a high frequency, low frequency or sub bottom channel. The following values are supported:
- 1 - High frequency return envelope;
- 2 - Low frequency return envelope;
- 5 - Sub bottom sample data (water surface removed).
Date
The date part of the ping's timestamp. You can choose between a short or long date format (or use them both). See the example data in the introduction for an example of a short and long date. The format used to write date values can be changed in the "System Settings".
Time
The ping's timestamp See the example data in the introduction for an example of how this timestamp is written to the file. The format used to write time values can be changed in the "System Settings".
Z-Value
The depth value associated with this ping. This depth value is written using the same vertical units as used in the project. Please note that the unit itself is not stored inside the file.
Range (min and max)
Writes the starting and ending range of the water column. When also exporting the "Number of Samples" field, you can divide the difference between the start and ending depth by the number of samples to get the resolution of the sample data. For instance: The minimum range is 5 meters, the maximum range is 25 meters and the sample count is 1600 results in a resolution of ( ( 25 - 5 ) / 1600 ) = 1,25 cm per sample.
Number of samples
Writes the number of samples (or sample count) following the selected data fields. You can use this number to check if all samples are written to the file, to know how many values need to be read from the file, or to calculate the sample resolution by using the range values (see range field description above).
Select the ping range
Using the ping range you can export only a selection of the data in the raw data file. By default all pings will be exported. The software will detect the number of pings in the data when clicking the "Select all pings" button. This function can be useful if you only want to analyze a part of the file, or want to limit the exported file size.
Select the sample range
Using the sample range you can export only a selection of the sample data per ping in the raw data file. By default all samples will be exported. The software will detect the number of samples in the data when clicking the "Select all samples" button. This function can be useful if you only want to analyze a part of the return envelope, or want to ignore the data from the transmission or back scatter (deadzone).
Exporting the data
When all preferences have been set, click the "OK" button to export the data. When finished the software will open the folder which contains the exported files in Windows Explorer.
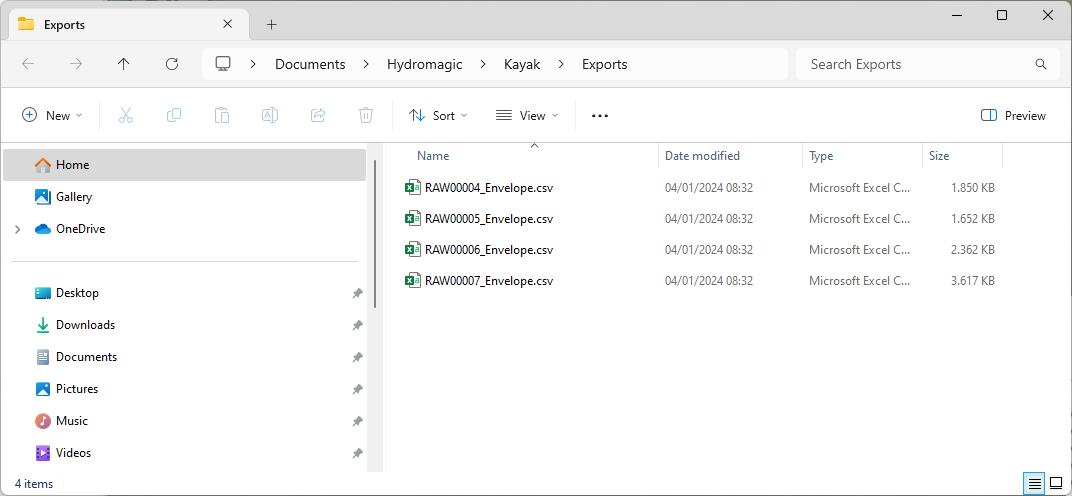
The exported files will appear in the select folder which is opened when the export finishes..
Video Tutorial
The following YouTube video tutorial shows how to export echo return data CSV files. Click below to play the video. When you like the video, please click the like button and subscribe so you will receive an update when new video tutorials on Hydromagic are uploaded.
Hydromagic can export echo return data as human readable text files.